Kubernetes Observability: A Comprehensive Guide to Monitoring Your Cloud-Native Applications
As Kubernetes has become the leading platform for container orchestration, maintaining visibility and control over these dynamic environments is more critical than ever. Kubernetes observability provides the insights needed to monitor, troubleshoot, and optimize your applications effectively. This guide explores the essentials of Kubernetes observability, including its importance, the challenges you may face, best practices to follow, and the latest tools to help you stay ahead.
Understanding Kubernetes Observability
What Is Kubernetes Observability?
Kubernetes observability refers to the practice of gaining deep insights into the behavior and performance of applications running on Kubernetes clusters. It involves collecting, analyzing, and correlating data from various sources—such as logs, metrics, and traces—to understand the system’s internal state and diagnose issues effectively. This comprehensive approach is essential for managing the complexity of Kubernetes environments and ensuring optimal performance.
How It Differs from Traditional Observability
Traditional observability typically focuses on static environments like virtual machines. In contrast, Kubernetes observability must handle a more dynamic ecosystem with multiple interacting layers—containers, pods, nodes, and services. This complexity requires a holistic approach to observability that goes beyond traditional methods.
Importance of Kubernetes Observability
Kubernetes observability is essential for several key reasons:
Managing Complexity: Kubernetes clusters are inherently complex, composed of numerous interdependent components such as pods, nodes, services, and networking elements. This complexity can make it challenging to pinpoint issues when they arise. Observability provides the visibility necessary to understand how these components interact, allowing you to diagnose and resolve problems more effectively. You can maintain control over even the most intricate environments by capturing detailed insights into every part of your cluster.
Ensuring Reliability: Reliability is a cornerstone of any successful application deployment. In Kubernetes, where workloads are often distributed across multiple nodes and regions, ensuring that all components function as expected is crucial. Observability enables you to detect and address issues before they escalate into outages so your services remain available and performant. By continuously monitoring your Kubernetes environment, you can identify and mitigate potential risks before they affect end-users.
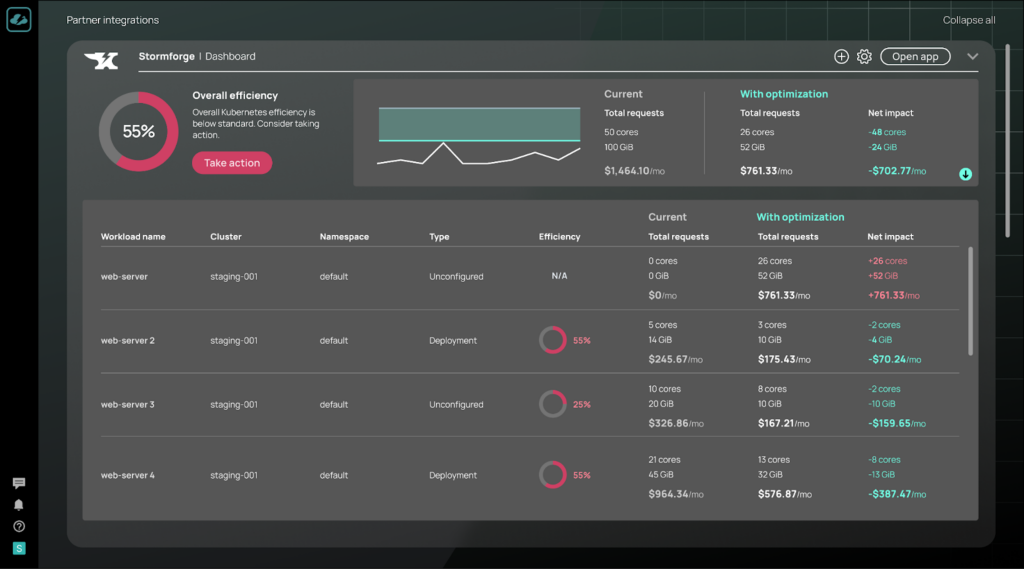
Optimizing Performance: Performance optimization is another critical aspect of maintaining a healthy Kubernetes environment. With observability, you can monitor key performance metrics, such as CPU usage, memory consumption, and request latency, to identify bottlenecks and inefficiencies. Mature organizations often rely on automated solutions like StormForge, which offers adaptive performance optimization that scales in alignment with financial goals. By leveraging such tools, you can ensure that your resources are utilized efficiently, making informed decisions about scaling, resource allocation, and system tuning to enhance application and infrastructure performance.
Facilitating Troubleshooting: When issues do arise, the ability to troubleshoot them quickly is vital. Observability tools provide the detailed data needed to track down the root cause of problems, whether from within the application, the underlying infrastructure, or external dependencies. By correlating logs, metrics, and traces, you can follow the flow of requests through your system, identify where failures occur, and implement fixes more rapidly, minimizing downtime and disruption.
Supporting Capacity Planning: As your workloads grow, so do your resource requirements. Observability is crucial in capacity planning by providing insights into resource utilization trends. StormForge’s AI/ML capabilities analyze usage and performance data in real-time, enabling more innovative and efficient autoscaling. By leveraging advanced tools, you can predict future needs and ensure your Kubernetes clusters can handle increasing demand, all while minimizing waste and maintaining peak efficiency.
Use Cases for Kubernetes Observability
Kubernetes observability isn’t just a theoretical concept—it’s a practical necessity in several common scenarios. Here are some use cases where Kubernetes observability proves invaluable:
CI/CD Pipelines: Continuous Integration and Continuous Deployment (CI/CD) pipelines are central to modern software development practices, especially in Kubernetes environments where rapid deployment of new features is standard. Observability in CI/CD pipelines ensures that you can monitor the stability and performance of applications throughout the development and deployment process. By tracking metrics and logs from the build, test, and deployment stages, you can identify issues early, such as failed builds or degraded performance, and resolve them before they reach production. This reduces the risk of introducing bugs into live environments and helps maintain the overall health of your deployment pipeline.
Microservices Architectures: In microservices architectures, applications are broken down into smaller, independently deployable services that interact with one another over the network. While this approach offers scalability and flexibility, it also introduces complexity, particularly in monitoring and troubleshooting. Kubernetes observability helps track interactions between microservices, providing visibility into request flows, latency, and error rates. This level of insight is crucial for identifying performance bottlenecks, understanding dependencies between services, and ensuring that the overall system operates smoothly. Observability also aids in diagnosing issues that may arise from communication failures or resource contention among microservices.
Hybrid Cloud Deployments: Many organizations adopt hybrid cloud strategies, where workloads are distributed across on-premises data centers and public or private clouds. Managing and monitoring such a distributed environment can be challenging. Kubernetes observability tools provide a unified view across these disparate environments, allowing you to monitor the performance and health of both on-premises and cloud-based components. By collecting and correlating data from all parts of your hybrid infrastructure, you can ensure consistent performance, quickly identify issues regardless of where they occur, and make informed decisions about workload placement and resource allocation.
The Pillars of Kubernetes Observability
Effective Kubernetes observability is built on three key pillars:
Logs: Provide a detailed record of events within the system, which is crucial for understanding the context of issues.
Metrics: Offer quantitative data on system performance, helping identify trends and correlate them with performance issues.
Traces: Track the flow of requests through the system, providing visibility into the interactions between components.
Visualization: The Fourth Pillar
Visualization ties these pillars together by making data accessible to interpret and actionable. Tools like Grafana and Kibana allow you to create dashboards that display real-time and historical data, helping you quickly identify anomalies and understand the state of your Kubernetes clusters.
Challenges and Solutions in Kubernetes Observability
While Kubernetes observability is essential for maintaining the health and performance of your cloud-native applications, it also comes with its challenges. Understanding these challenges and implementing effective solutions is vital to creating a robust observability strategy.
Disparate Data Sources
One of the primary challenges in Kubernetes observability is the distribution of data across various components and layers of the system. Kubernetes clusters generate a wealth of data—logs, metrics, traces—from different sources, such as the control plane, worker nodes, pods, containers, and external tools. This data is often scattered and siloed, making gaining a unified view of the entire environment difficult.
Solution: Using centralized observability platforms to aggregate and correlate data from all these sources is crucial. Tools like Prometheus, Fluentd, and Jaeger are designed to collect, process, and visualize data from multiple sources, providing a comprehensive view of your Kubernetes environment. By centralizing your observability data, you can break down silos, enabling more efficient monitoring, troubleshooting, and optimization.
Dynamic Environments
Kubernetes environments are inherently dynamic, with resources frequently added, removed, or reallocated based on demand. While beneficial for scalability and flexibility, this fluidity poses a significant challenge for maintaining observability. Traditional monitoring tools that rely on static configurations can struggle to keep up with these constant changes, leading to gaps in monitoring coverage and delayed detection of issues.
Solution: Implementing real-time monitoring tools designed to adapt to the dynamic nature of Kubernetes is essential. Tools that utilize Kubernetes’ native APIs, such as the metrics-server or those that leverage technologies like eBPF, can provide continuous visibility into your environment, regardless of changes in resource allocation. Automation tools like Kubernetes Operators and Helm can also help maintain consistency in your observability setup as your environment evolves.
Abstract Data Sources
Kubernetes does not provide a centralized logging or metrics system by default. Instead, logs and metrics are generated at various points in the system, such as within containers, nodes, and the control plane, and need to be collected and aggregated manually. This abstraction can make obtaining a holistic view of system performance and health challenging, particularly in large and complex clusters.
Solution: To overcome this challenge, deploying tools like Fluentd for log aggregation and Prometheus for metrics collection is highly recommended. These tools can be configured to collect data from all relevant sources, ensuring that you have access to comprehensive and centralized observability data. Additionally, integrating these tools with visualization platforms like Grafana can help you turn raw data into actionable insights, making monitoring and managing your Kubernetes environment easier.
Cost
Observability, while essential, can be resource-intensive. The processes involved in collecting, storing, and analyzing large volumes of data can lead to significant costs, both in terms of infrastructure resources and financial expenditure. These costs can escalate quickly, particularly in large-scale Kubernetes deployments, making maintaining a cost-effective observability strategy challenging.
Solution: To reduce the costs associated with observability tools, it’s crucial to optimize data collection and storage. Techniques such as reducing data retention periods, focusing on high-value metrics, and employing more efficient data collection methods like eBPF can help minimize resource consumption. Leveraging tiered storage solutions, such as cloud-based services that offer lower costs for long-term storage, is another way to control spending.
While observability tools provide valuable insights into increasing resource usage, they don’t actively manage or reduce cloud costs. However, solutions like CloudBolt and StormForge can complement observability by optimizing resource allocation in real time. By rightsizing workloads, they help reduce the resources that need to be monitored, further controlling the costs associated with observability efforts.
Best Practices for Kubernetes Observability
Implementing Kubernetes observability effectively requires a strategic approach that addresses the unique challenges of dynamic and complex environments. By following these best practices, you can ensure that your observability strategy is comprehensive and efficient, leading to better performance, reliability, and scalability of your Kubernetes clusters.
1. Choose the Right Tools for Your Environment
Selecting the appropriate observability tools is the foundation of a successful strategy. Given the specialized needs of Kubernetes environments, it’s essential to opt for tools that are purpose-built for Kubernetes and integrate seamlessly with its architecture.
Considerations:
- Kubernetes-Native Capabilities: Tools like Prometheus for metrics collection, Fluentd for log aggregation, and Jaeger for distributed tracing are explicitly designed to work within Kubernetes environments. They provide deep integrations with Kubernetes APIs and can monitor Kubernetes-specific components like pods, nodes, and services.
- Scalability: Ensure your chosen tools can scale with your environment as it grows. CloudBolt offers a scalable solution that optimizes Kubernetes resources in real time so your observability efforts remain cost-effective even as data volumes increase.
- Ease of Integration: Opt for tools that easily integrate with your existing infrastructure and other observability tools. Seamless integration reduces the complexity of your monitoring setup and helps you maintain a unified observability platform.
2. Establish a Unified Observability Platform
Kubernetes environments generate a wealth of data from various sources, including logs, metrics, and traces. To make sense of this data, it’s crucial to aggregate it into a single, unified platform that can be correlated and analyzed.
Best Practices:
- Data Centralization: Use a centralized observability platform to collect data from all relevant sources, ensuring a comprehensive view of your environment. Centralizing data also makes it easier to perform complex queries and cross-reference different types of observability data.
- Correlation and Contextualization: Correlate data from logs, metrics, and traces to provide context to your collected information. For example, if you notice a spike in CPU usage, you can cross-reference this with logs and traces to determine if it coincides with a specific event or request.
3. Automate Observability Processes
Kubernetes environments are dynamic, with frequent changes in resource allocation, deployments, and configurations. Manually managing observability in such an environment is time-consuming and prone to errors. Automation can help streamline observability processes, ensuring consistency and reducing the likelihood of oversight.
Automation Strategies:
- Use Kubernetes Operators: Kubernetes Operators can automate observability tool deployment, configuration, and management. They help ensure that observability components are consistently configured and remain up-to-date as your environment evolves.
- Implement Continuous Monitoring: Set up automated monitoring that adjusts to changes in your environment. Tools that leverage Kubernetes APIs can automatically detect new pods, services, or nodes and start monitoring them without manual intervention.
- Alerting and Incident Response: Automate alerting based on predefined thresholds and use automation tools to initiate incident response processes.
4. Leverage Historical Data for Trend Analysis and Forecasting
While real-time monitoring is crucial for immediate issue detection, historical data provides valuable insights into long-term trends and patterns essential for proactive system management.
Utilizing Historical Data:
- Trend Analysis: Regularly analyze historical data to identify trends in resource usage, performance, and system behavior. This analysis can help you spot recurring issues, seasonal patterns, or gradual performance degradation that may not be apparent in real-time data.
- Capacity Planning: Use historical data to forecast future resource needs. By leveraging CloudBolt’s detailed cost tracking and StormForge’s predictive analytics, you can ensure that your Kubernetes clusters are always adequately provisioned without overspending.
- Performance Benchmarking: Historical data can also benchmark system performance over time. By comparing current performance against historical benchmarks, you can assess the effectiveness of optimizations and make data-driven decisions to improve system efficiency further.
5. Optimize Resource Usage and Cost Management
Observability tools can be resource-intensive, consuming significant amounts of CPU, memory, and storage. Inefficient observability processes can lead to increased costs, particularly in large-scale environments. Optimizing the resource usage of observability tools themselves is essential for maintaining a cost-effective strategy.
Optimization Techniques:
- Efficient Data Collection: Utilize lightweight data collection methods, such as eBPF-based tools, which minimize resource overhead while still providing deep insights into system performance. These tools run in the kernel space, allowing for high-efficiency monitoring with minimal impact on application performance.
- Data Retention Policies: Implement data retention policies to manage storage costs. Archive or delete old data that is no longer needed for real-time monitoring or immediate troubleshooting. For long-term storage, consider using cloud-based solutions like Amazon S3 Glacier, which offer tiered pricing and cost savings for infrequently accessed data.
- Focused Monitoring: Prioritize monitoring critical components and high-value metrics. While it’s essential to have comprehensive observability, not all data is equally valuable. Focus on monitoring the aspects of your system that have the most significant impact on performance, reliability, and user experience.
Complementary Cost Optimization Solutions: While optimizing observability tools is crucial, it’s important to note that observability itself doesn’t directly reduce cloud costs. Solutions like CloudBolt and StormForge complement these efforts by actively managing and rightsizing your Kubernetes workloads, driving more efficient resource usage throughout your environment.
6. Set Realistic Performance Goals and Alerts
Setting appropriate performance goals and configuring alerts is critical for maintaining the health of your Kubernetes environment. However, it’s important to balance being informed and avoiding alert fatigue.
Best Practices:
- Define Key Performance Indicators (KPIs): Identify and define KPIs that are most relevant to your business objectives and system performance. These include metrics such as request latency, error rates, resource utilization, and uptime. Ensure your KPIs are measurable, attainable, and aligned with your organization’s goals.
- Threshold-Based Alerts: Configure alerts based on thresholds that are meaningful and actionable. Avoid setting thresholds too low, which can lead to unnecessary alerts and overwhelm your team. Instead, focus on setting thresholds that indicate genuine performance issues that require immediate attention.
- Contextual Alerts: Implement context-based alerting, triggering alerts by raw metrics and correlated data that considers the broader context. For example, an alert for high CPU usage should consider whether it coincides with an increase in traffic or a known deployment event. This approach helps reduce false positives and ensures that alerts indicate issues that must be addressed.
7. Foster a Culture of Continuous Improvement
Observability is not a one-time setup but an ongoing process that evolves with your system. Encouraging a culture of continuous improvement ensures that your observability strategy remains effective as your Kubernetes environment grows and changes.
Continuous Improvement Practices:
- Regular Audits: Conduct regular audits of your observability setup to identify areas for improvement. This includes reviewing the effectiveness of your tools, the accuracy of your monitoring data, and the relevance of your alerts. Audits can help you adapt your observability strategy to new challenges and ensure it remains aligned with your operational goals.
- Feedback Loops: Establish feedback loops where team members can share insights and suggestions for improving observability processes. This collaborative approach fosters innovation and helps your team stay ahead of emerging challenges.
- Stay Informed: Keep up with the latest developments in Kubernetes observability tools and best practices. The Kubernetes ecosystem continually evolves, and staying informed about new features, tools, and techniques can help you enhance your observability strategy over time.
Optimize Your Kubernetes Observability with CloudBolt and StormForge
Kubernetes observability is crucial for maintaining your cloud-native applications’ health, performance, and reliability. By understanding the core pillars of observability—logs, metrics, traces, and visualization—and addressing the unique challenges of Kubernetes environments, you can optimize your systems effectively.
If you’re ready to take your Kubernetes operations to the next level, CloudBolt and StormForge offer a robust solution that integrates advanced machine learning for real-time resource management and cost optimization. Discover how our partnership can enhance your Kubernetes environment by scheduling a demo or learning more about our solution.
Related Blogs

The End of Manual Optimization: Why We Acquired StormForge
Today is a big day for CloudBolt—we’ve officially announced our acquisition of StormForge. This marks a major milestone for us…